Aging and the U.S. Economy
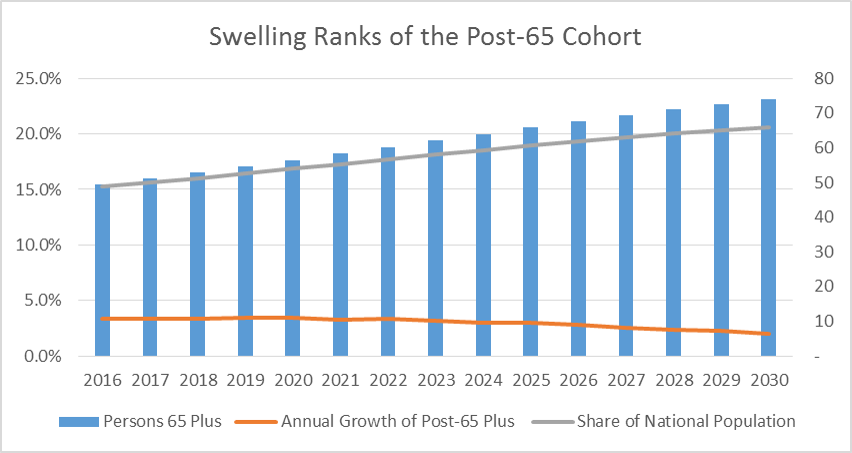
The U.S. population is aging. In 2016, 15% of the population (49 million people) was age 65 and older, and by 2030, 21% of the population (74 million people) will be past retirement age. By comparison, in 1936, when Social Security was established, 6.2% of the U.S. population was over 65 (8 million people). The swelling of the post-retirement cohort stems from the post-Great Depression acceleration in births that began in 1934 as well as from improved longevity associated with medical advances and healthier lifestyle choices in the last several decades.
The aging of the U.S. population has many implications. Touching upon them all would require several articles. For now, this article will briefly highlight three of them: the potential negative effects on the labor force and the growth of the economy; the fiscal impact on the federal government’s entitlement programs; and the impact on housing and care provisions for seniors.
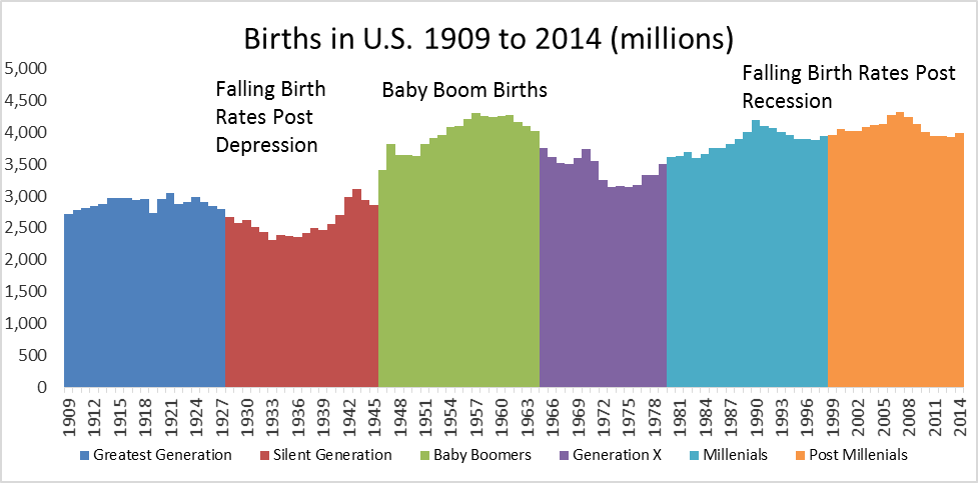
Before discussing these implications, let’s look at the following chart, which at least partly shows how we got here. It provides a detailed look at the number of live births per year in the U.S., from 1909 to today. A few notable things stand out. First, the slowdown in births seen most recently after 2007 reflects the effects of the Great Recession of 2007. As the economy weakened, fewer couples felt comfortable having children. This pattern is also evident in the period following 1924 after the Great Depression, as fewer children were born in the years following this period of economic contraction. Second, the opposite effect can be seen in the years following World War II, when there was a surge of births in a period of perceived relative prosperity and optimism. This gave way to the abundance of children born in the 1946 to 1964 period, referred to as the baby boomers. Presently, those born prior to 1951 are 65 years of age or older, and are the topic of this article. Going forward, however, the impact of higher birth rates in the 1940s, 1950s, and 1960s will be felt further as the aging baby boomers continue to add to the ranks of post-65-year-olds through 2030.
Labor Force and Economic Growth
Speculation about the effects the swelling ranks of retired baby boomers will have has ranged from serious academic research among scholars and well-intentioned, planned strategies for policymakers to sometimes bizarre but entertaining theories of lifestyles and choices. Amid the speculation, however, are some likely outcomes, starting with the probability of a smaller and potentially less productive labor force, which in turn will slow the overall economy’s potential growth. In its most recent Annual Report, the Atlanta Federal Reserve Bank highlighted these effects in a series of articles titled “The Graying of the American Economy.” The author, Charles Davidson, explains the impact of a shrinking labor force on economic growth:
“. . . the size of the labor force is a key ingredient in the economy’s growth potential. Put in the simplest terms, the economy’s long-term growth rate is the sum of the growth rate of labor employed plus the growth rate of the productivity of that labor . . . [and] the demographic erosion of the labor force from an aging population . . . appears unstoppable, absent a significant change such as a large influx of immigrants or a steep decline in the rate of retirement.”
Several organizations, including the U.S. Bureau of Labor Statistics (BLS) and the Congressional Budget Office (CBO), predict the labor force will expand by only 0.5% to 0.6% per year on average between now and 2050. That is one-third the pace of 1.7% experienced between 1970 and 2007. This, in turn, will slow the overall potential growth of the U.S. economy, barring an exceptional advance in labor productivity (or output per worker) that could more than offset a smaller labor pool. As a result of these conditions, prognosticators project inflation-adjusted GDP growth slipping—from the more than 3% per year on average we saw in the 1980s to early 2000s down to 2.1% or less for the next ten years.
That said, there is evidence that many prospective retirees are delaying their retirement dates, parties, and celebrations because they need to continue earning money, or because they want to remain in the workforce and stay productive for either personal reasons or to contribute to the “greater good.” This suggests that current estimates regarding the magnitude of the declines in the labor force participation rates and labor force growth may be a bit overstated.
Fiscal Impact
In addition to a shrinking pool of workers, a decline in the number of older workers would likely cause tax revenues to weaken, which could simultaneously reduce funding for publically-funded older-age support systems (such as Social Security and Medicare) and increase the number of retirees that the workforce supports. An aging population directly affects the so-called dependency ratio (the number of working-age persons in the U.S. for every retiree).
In 2010, there were 4.8 workers for each retiree in the U.S. According to projections by the U.S. Census Bureau and reported by the Atlanta Fed; this ratio will decline to 2.7 by 2040. This change will impact the sustainability of Social Security and Medicare—the two largest government-sponsored support programs for seniors—because benefits to current retirees are largely financed by payroll taxes paid by current workers. In 2014, Social Security outlays totaled about 5% of gross domestic product (GDP), and Medicare spending equaled about 3.5% of GDP. The Social Security Administration projects that by 2034 Social Security expenditures will rise to 6% of GDP and that Medicare costs will increase to 5.4% of GDP. If benefits are maintained at their current levels, the projected changes in the dependency ratio will dramatically affect take-home pay for the nation’s younger cohorts, who will be paying larger portions of their paychecks in taxes to support entitlement programs. Alternatively, benefit offerings will have to be pared back or modified. It is likely that both outcomes to some degree will occur.
Seniors Housing
In addition to the dependency ratio discussed previously, the nation’s current demographic mix will result in fewer family caregivers for every senior. In 2016, there were seven persons aged 45-64 (adult children of the seniors) for every senior. By 2030, according to projections by the U.S. Census Bureau, this ratio will drop back to 4:1 and, by 2050, to 3:1. This largely reflects the lower birth rates for today’s adult children compared with today’s seniors. As this happens, alternative housing and care options will need to be expanded and created.
Today, there exist three million institutional-grade seniors housing and care units (including skilled nursing properties), as tracked by NIC. This includes only market-rate units in properties with more than 25 units. Age-restricted housing communities, as well as board and care and other smaller property options, are also available, pushing the number of available congregate living housing choices even higher. However, relative to the number of persons who are older than 65, the penetration rate for today’s housing options for seniors (65+) is limited (6% for NIC’s inventory). This suggests that, as this population ages, today’s seniors’ housing inventory will need to be expanded significantly from today’s rate of growth of roughly 22,000 units per year to a number significantly more than that. It also suggests that new community-based housing options will emerge. These might include alternative housing options such as naturally occurring retirement communities (NORCs), which occur without planning; communes, such as those lived in by many of today’s retirees in their 20s and 30s; the villages model, where neighbors volunteer and share services and resources; and properties purchased by groups of long-time friends. Home-based options with services brought in will also grow in importance.
As is often said, the baby boomer generation never does things the way their parents did things, and they always change the conventional wisdom about behaviors and norms. For the next 9 years through 2029, baby boomers will be reaching age 65, and as this massive wave of individuals approach retirement, the economy, social structures, and housing and care services will forever be altered.


